
A technician pulls the access panel, shines a light down the trunk line, and sees bare metal. No dust. No debris. By every visual standard, the job looks finished.
Then someone checks the registers with an anemometer and finds airflow still sitting 12% below design. The duct is clean. The system still isn’t performing.
This is the gap that post-cleaning performance testing exists to close. Visual inspection confirms that contaminant has been removed. It says nothing about whether the system can actually move the air it was designed to move. Those are two different engineering questions, and conflating them is one of the most common gaps in duct cleaning quality assurance.
Airflow performance testing is the verification step that separates a cosmetic cleaning from a documented, measurable improvement in system function. For contractors working commercial and light-commercial HVAC systems, it’s also the evidence that justifies the job to a facilities manager who cares about energy costs and comfort complaints, not dust photos. It’s also the natural follow-up question to how much CFM a job actually required in the first place: extraction volume determines the target, and post-cleaning testing confirms whether the system reached it.
This article focuses specifically on the testing methodology used to verify airflow recovery after extraction work is complete. It does not cover cleaning technique itself.
Contractors performing this kind of verification work are typically using the same air duct cleaning equipment throughout the job, from initial negative pressure setup through final airflow confirmation. The testing phase is where that equipment’s impact gets quantified rather than assumed.
Visual Cleanliness vs. Airflow Performance: Two Different Metrics
Visual cleanliness measures contaminant removal. Airflow performance measures system function. A duct can score well on one and poorly on the other, and understanding why matters more than most contractors initially assume.
Debris removal addresses gross obstruction: dust cake, insulation fragments, biological growth, construction residue sitting in the duct interior. Once that material is gone, the duct looks clean under inspection.
But airflow resistance isn’t only a function of visible debris. It’s a function of effective cross-sectional area, surface roughness, and the condition of every component in the air path, including ones a camera never sees. A partially collapsed flex run, a damper left in the wrong position during cleaning, a filter that wasn’t reinstalled correctly, or a return path with unaddressed leakage can all suppress airflow after the ducts themselves are spotless.
This is why NADCA-aligned quality assurance frameworks increasingly separate contamination assessment from performance assessment as two distinct verification tasks. A contractor who only checks for cleanliness is documenting half the job.
What Post-Cleaning Performance Testing Actually Verifies
Post-cleaning performance testing quantifies whether the HVAC system is delivering design airflow, or a documented percentage of it, after extraction work is finished. It answers three specific questions:
Did airflow recover to baseline or design specification?
Are there restrictions that survived the cleaning process?
Is the system balanced, meaning is air distribution proportional across registers rather than concentrated in a few?
These aren’t rhetorical questions. Each one requires a measurement, not an impression.
Baseline Measurements: Why They Have to Come First
Airflow recovery is a comparison, and a comparison requires two data points. Testing that only happens after cleaning, with no baseline reference, produces a number with no context.
Baseline testing should occur before extraction begins, using the same instrumentation and the same test locations that will be used for the post-cleaning measurement. This matters because airflow readings are sensitive to test conditions. A register measured with the system in cooling mode won’t match a reading taken in heating mode. A reading taken with an interior door closed won’t match one taken with it open.
When baseline data doesn’t exist, which happens more often than contractors like to admit, the fallback is comparing measured airflow against the system’s design specification: the CFM the equipment was engineered to deliver at each register, derived from the air handler’s rated capacity and the duct system’s design documents. This is a weaker comparison than a true before-and-after baseline, but it’s still more defensible than an undocumented visual assessment.
Instrumentation for Airflow Testing
Different instruments measure different things, and using the wrong one for a given task produces numbers that look precise but mean the wrong thing.
Anemometers
A vane anemometer or hot-wire anemometer measures air velocity, typically in feet per minute, at a single point. Velocity alone isn’t airflow volume. To convert a velocity reading into CFM, that number has to be multiplied by the effective free area of the opening being measured, and averaged across multiple points if the airflow across the opening isn’t uniform, which it rarely is.
Flow Hoods
A flow hood captures the entire airflow from a register or diffuser and reports volumetric airflow directly in CFM. This eliminates the velocity-to-volume conversion step and is generally the more reliable instrument for register-level airflow verification, provided the hood is sized correctly for the register and seated to prevent air bypass around the hood’s skirt.
Manometers and Pressure Gauges
A manometer measures pressure differential, not airflow directly. In duct testing, it’s used to capture static pressure at defined points in the system: across the filter, across the coil, at the supply plenum, and at the return. Static pressure readings are diagnostic. They tell a technician where resistance exists in the system even when a direct airflow reading at that point isn’t practical.
Airflow Meters and Duct Traverse Instruments
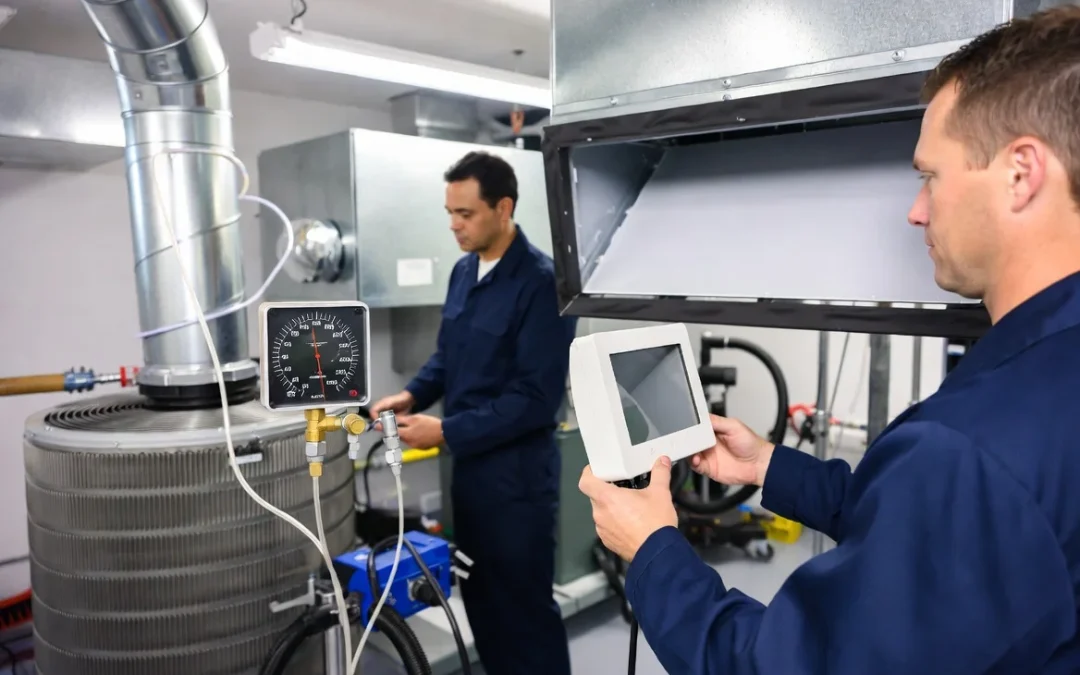
For trunk-line or main duct measurements where a flow hood isn’t practical, a pitot tube traverse or an in-duct airflow meter is used to calculate volumetric flow across the full duct cross-section, using multiple velocity readings taken at defined grid points and averaged according to standard traverse methodology.
Measuring Supply Airflow and Return Airflow
Supply airflow and return airflow have to be measured separately, because a system can show acceptable supply numbers while quietly starving on the return side, or the reverse.
Supply airflow is measured at each register using a flow hood, with readings recorded individually rather than only as a system total. A total that matches design specification can still hide a badly unbalanced distribution if some registers are over-delivering while others are under-delivering.
Return airflow is measured at return grilles using the same instrumentation, and it deserves more attention than it typically gets. A duct cleaning job that clears the supply trunk but leaves a restricted or undersized return path in place will show improved supply-side readings while the system continues to work harder than it should, because the blower is still fighting resistance on the intake side.
Static Pressure Comparison Before and After Cleaning
Static pressure is one of the most underused diagnostic tools in post-cleaning verification, largely because it requires a manometer and a bit more procedural discipline than a quick velocity check. For contractors who want the full diagnostic methodology behind this measurement, our breakdown on diagnosing airflow resistance in complex HVAC ductwork covers how to read a pressure profile port by port.
Total external static pressure, measured across the air handler, reflects the cumulative resistance of the entire duct system: filter, coil, ductwork, registers, and any accessories in the air path. A high pre-cleaning static pressure reading that drops meaningfully after cleaning is strong evidence that the extraction work reduced system resistance, independent of what the CFM numbers show.
Component-level static pressure readings, taken across the filter and across the coil specifically, help isolate where remaining resistance is coming from. If total static pressure improves only marginally after cleaning, a component-level reading often reveals that the restriction was never primarily in the duct run at all.
Air Velocity vs. Airflow Volume: Why the Distinction Matters in Reporting
Velocity and volume get used interchangeably in casual conversation, and that habit causes real reporting errors. Velocity describes how fast air is moving at a point. Volume, expressed as CFM, describes how much air is moving through an opening over time.
A register with high velocity and a small free area can deliver the same CFM as a larger register with lower velocity. Reporting velocity alone, without accounting for the register’s effective area, produces numbers that look impressive but don’t actually answer the airflow recovery question a facilities manager is asking.
Every performance report should express results in CFM at the register level and, where relevant, in feet per minute for point diagnostics like sensing duct leakage at a joint. Mixing the two without labeling them clearly is a common source of client confusion.
Register-by-Register Airflow Verification
System-level totals are useful for a summary report, but they can mask problems that only show up register by register. A building can hit 95% of total design CFM while one branch runs at 60% and another runs at 130%, compensating for it in the average.
Register-by-register testing means measuring every conditioned space individually, not sampling a handful of representative rooms. This is more time-intensive, but it’s the only method that reliably identifies branch-level restrictions, damper misconfiguration, or a run that was never fully cleared during extraction.
Where a register reads well below its design CFM despite the branch duct testing clean, the restriction is usually downstream of the duct itself: a closed or partially closed damper, a crushed flex connector at the boot, or a register with a damaged blade assembly. This register-level discipline is also what separates a cleaning verification from true system balancing to restore design-spec HVAC airflow, which uses the same instrumentation to redistribute airflow rather than simply confirm it.
Identifying Restrictions That Remain After Cleaning
Cleaning removes debris. It doesn’t repair mechanical problems, and testing is what exposes the ones that debris removal never addressed in the first place.
Common post-cleaning restrictions include collapsed or kinked flexible duct that wasn’t visible until airflow, rather than a flashlight, revealed it; undersized branch takeoffs that were undersized from installation and were never going to hit design CFM regardless of cleanliness; damper blades left in a partially closed position, sometimes closed deliberately during the cleaning process and never reopened; and coil or filter restriction unrelated to the duct system entirely.
A performance test that identifies one of these issues isn’t a failed cleaning. It’s a successful diagnostic outcome, and documenting it protects the contractor from being blamed for a mechanical condition the cleaning process was never going to fix.
Filter Condition and Its Effect on Airflow Readings
A dirty filter installed after cleaning will suppress every downstream airflow reading, regardless of how effective the extraction work was. This is one of the more preventable sources of misleading post-cleaning data.
Filter resistance increases as a filter loads with particulate, and that resistance shows up directly as reduced static pressure differential available to move air through the rest of the system. Testing immediately after cleaning with an old filter still in place will understate the airflow improvement the cleaning actually achieved.
The filter’s MERV rating also matters independent of loading. A higher-MERV filter installed as part of the service, even if new, carries more inherent resistance than the filter it replaced, and that resistance needs to be accounted for when interpreting whether an airflow shortfall is a duct issue or a filtration tradeoff. Our technical piece on how filter loading affects HVAC extraction performance covers the media dust-holding capacity and face-velocity mechanics behind this in more depth.
Blower Performance Considerations
The duct system doesn’t move air on its own. The blower does, and its condition sets an upper limit on what any amount of duct cleaning can achieve.
A blower wheel with buildup on the blades, a slipping belt on a belt-drive unit, or a motor running below its rated speed will cap system airflow regardless of how clear the ductwork is. If post-cleaning testing shows airflow recovery well below expectations even after ruling out duct restrictions and filter condition, blower condition is the next place to look, and it’s worth flagging in the report as outside the scope of duct cleaning itself.
Damper Position Verification
Dampers are a frequent, quietly overlooked source of post-cleaning airflow discrepancy. Manual balancing dampers, fire dampers, and zone dampers can all be repositioned incidentally during the cleaning process, whether from equipment contact, panel removal, or simple oversight during reassembly.
Verifying damper position before final testing, rather than assuming dampers were left as found, prevents a false negative: a branch that reads poorly not because of a remaining restriction, but because a damper is sitting at 40% open instead of its pre-service position.
Air Leakage and Its Effect on Measured Airflow
Duct leakage introduces a gap between what the blower is pushing and what actually reaches the register being tested. Air lost through unsealed joints, damaged flex connections, or gaps at boot connections never shows up in the register reading, even though the blower is working to move it.
This matters for interpretation. A register reading below design CFM could reflect a genuine duct restriction, or it could reflect leakage upstream of that register pulling air out of the system before it arrives. Total static pressure and total system CFM measured at the air handler, compared against the sum of individual register readings, will usually reveal a leakage gap if one exists: system-level output that doesn’t reconcile with register-level totals is a leakage signature, not a restriction signature. Contractors who suspect this going in should pair performance testing with a proper duct leakage inspection, since a system already known to be leaking changes how the register-level shortfall should be read.
HVAC Operating Conditions During Testing
Airflow readings are only comparable if the conditions they were taken under are comparable. Testing protocol should hold operating conditions constant between baseline and post-cleaning measurements wherever possible.
That means testing in the same system mode, heating or cooling, since blower speed and static pressure behavior can differ between the two on multi-speed and variable-speed equipment. It means testing with the same interior door and damper configuration. And it means allowing the system to run long enough to reach steady-state airflow before taking a reading, since airflow at the moment of startup doesn’t reflect sustained operating performance.
Documenting and Reporting Performance Results
A performance test that isn’t documented in a way the client can understand doesn’t function as verification. It functions as an internal note.
Effective post-cleaning reports include baseline and post-cleaning readings side by side, not just the post-cleaning number in isolation. They express results in consistent units, CFM for volumetric readings and inches of water column for static pressure. They identify register-by-register results rather than a single system average, since that’s where discrepancies actually live. And they flag any conditions outside the scope of the cleaning itself, such as blower condition or filter upgrade, so the client understands what the numbers do and don’t attribute to the service performed.
This level of documentation is also what differentiates a cleaning service from a diagnostic service in the client’s mind, which has direct implications for how the work is priced and positioned.
Common Testing Mistakes and How Contractors Avoid Them
A handful of errors show up repeatedly in post-cleaning testing, and most of them are procedural rather than instrument-related.
Testing without a baseline is the most common. Without a pre-cleaning number, a post-cleaning reading has nothing to compare against except a design specification that may not reflect the system’s actual as-installed condition.
Mixing instrumentation between the baseline and post-cleaning test is another. Switching from an anemometer-based estimate to a flow hood reading between the two measurements introduces instrument-to-instrument variance that gets misread as system improvement or decline.
Testing with a dirty filter still installed understates results. Testing in an inconsistent system mode produces numbers that aren’t actually comparable. And testing only at the system level, without register-by-register data, hides the branch-level problems that matter most for occupant comfort complaints.
Avoiding these errors is less about better instruments and more about a documented, repeatable testing sequence that doesn’t vary from job to job.
Building a Repeatable Testing Procedure for Quality Assurance
The value of post-cleaning performance testing depends on consistency. A test procedure that changes from technician to technician, or from job to job, produces data that can’t be reliably compared over time or defended if a client questions the results.
A repeatable procedure defines, in advance, which instruments will be used for which measurements, which test points will be recorded, what system mode and operating conditions the test will run under, and how results will be documented. Locking these variables down before the job starts is what turns airflow performance testing from a spot-check into a genuine quality assurance process.
For contractors verifying system airflow after establishing negative pressure and breaking it down during extraction, the transition between the negative pressure phase and the performance testing phase is also worth standardizing, since equipment removal and duct reassembly introduce their own opportunities for a damper or connection to end up out of position before final testing begins.
Final Thoughts
Airflow performance testing exists because a clean duct and a properly functioning system are not the same claim, and only one of them can be verified visually. Instrumentation, consistent test conditions, and register-by-register documentation turn “the ducts are clean” into a measurable, defensible statement about system performance. That distinction is what separates a cleaning service from a diagnostic one, and it’s increasingly what commercial clients are asking contractors to prove.