

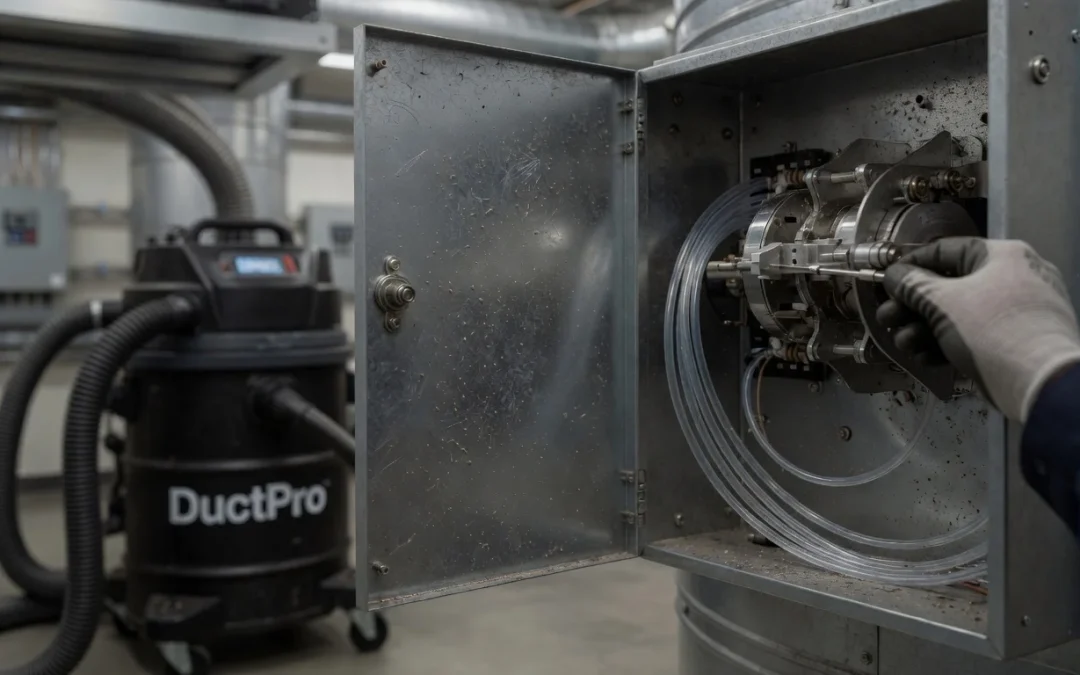
Particulate accumulation inside an hvac air filtration system introduces progressive resistance that alters the system performance curve. Evaluating media dust holding capacity, structural face velocity drops, and cake filtration mechanics prevents localized vacuum airflow collapse during extraction protocols.
That 40-word operational framing defines the exact failure mode this article addresses. When the extraction vacuum’s internal filtration loads to critical pressure drop thresholds mid-job, the fan curve shifts left and delivered CFM drops below the 3,500 FPM transport velocity required to convey coarse debris through commercial trunk lines. The result is debris re-deposition, extended job time, and a system that tests dirty on post-clean airflow verification. Every technician operating air duct cleaning equipment on a commercial extraction job needs to understand the fluid dynamics governing that failure and the filtration architecture that prevents it.
Cake Filtration Mechanics: The Math Behind Porous Media Resistance
Clean filter media operates in the depth filtration regime. Particles smaller than the fiber matrix pore diameter penetrate the media depth and are captured by inertial impaction, interception, and diffusion on individual fibers distributed through the media cross-section. Resistance is low: pressure drop across a clean panel is governed primarily by media structure and face velocity.
That regime changes the moment a deposited dust layer forms on the upstream face of the media. Once the surface dust concentration reaches a threshold areal density, typically 0.05 to 0.15 g/cm² depending on particle size distribution and media surface energy, the dominant filtration mechanism shifts from depth trapping to surface cake filtration. The deposited layer, not the media fiber matrix, becomes the primary collection surface. Every subsequent particle arriving at the media face must penetrate that cake before reaching the original media structure.
The resistance governing that process is expressed by the modified Darcy equation for porous media:
$$\Delta P = \frac{\mu \cdot V \cdot (r \cdot M_c + R_m)}{g_c}$$
Where:
- $\mu$ = dynamic viscosity of air (Pa·s), approximately 1.81 × 10⁻⁵ Pa·s at 20°C
- $V$ = face velocity (m/s)
- $r$ = specific cake resistance (m/kg), a function of particle size, shape, and packing density
- $M_c$ = cake mass per unit area (kg/m²), the critical time-variant term
- $R_m$ = clean filter medium resistance (m⁻¹), a fixed structural constant
- $g_c$ = dimensional conversion constant
The term $R_m$ is fixed and does not change with loading: it defines the clean filter baseline pressure drop. The term $r \cdot M_c$ grows continuously as the job progresses. Critically, as $M_c$ increases, the deposited cake compacts under its own weight and under the pressure differential acting across it. Cake compaction increases the local packing density, which in turn increases $r$.
Both variables in the product $r \cdot M_c$ are increasing simultaneously, meaning the result is not a linear pressure drop increase: it is a progressive, accelerating resistance growth that curves upward steeply once the cake exceeds a threshold areal mass.
At constant face velocity $V$, doubling $M_c$ more than doubles $\Delta P$ because $r$ has also increased through compaction. This is the mathematical basis for the non-linear loading behavior every technician observes empirically: a vacuum that runs at full performance for the first 40 minutes of a job, then degrades sharply over the next 15 minutes, then stalls. The filter did not fail at the stall point: the failure began at the inflection point on the $r \cdot M_c$ curve, and the stall was simply the endpoint of a compaction process that started much earlier.
For context on how these internal filter pressure drops interact with the external system resistance from trunk line friction and fitting losses, the hvac static pressure analysis metrics framework provides the combined static pressure budget methodology.
Particle Morphology and Media Loading Profiles: MERV to HEPA Realities
Filter media loading rate is not determined by particle count alone. Particle morphology, which includes the physical shape, density, and surface chemistry of each particle type, controls how rapidly the cake layer forms, how densely it packs, and how steeply $r$ escalates with increasing $M_c$.
MERV-8 Fiberglass Panels
MERV-8 media targets particles in the 3.0 to 10.0 micron range with a minimum efficiency of 70% per ASHRAE Standard 52.2 E3 particle size testing. The fiber matrix is coarse, with a mean fiber diameter in the 10 to 20 micron range and relatively open pore geometry.
Loading behavior: coarse particulate accumulates as a loose, high-porosity cake with relatively low $r$ values. The cake layer is mechanically fragile. Pressure drop increases gradually, and the panel has substantial dust holding capacity, typically 100 to 200 g/m² at terminal pressure drop, before the fan operating point shifts meaningfully. For a pre-filter stage capturing bulk debris on a residential or light commercial extraction job, MERV-8 panels provide effective mass loading capacity without imposing early pressure penalties.
MERV-13 Pleated Media
MERV-13 media addresses the 1.0 to 3.0 micron particle range with a minimum 85% efficiency at E2 particle sizing. Fiber matrix density is substantially higher than MERV-8. Mean fiber diameter drops to the 2 to 5 micron range, and the media relies on electrostatic enhancement in most commercial panel configurations.
The loading profile is sharply different: sub-3-micron particles like combustion soot, secondary aerosol particles, and biological fragments penetrate the outer media face and partially load the fiber depth before forming a surface cake. The electrostatic charge is progressively neutralized as the cake layer accumulates, eliminating the electrostatic capture contribution and reducing effective efficiency while pressure drop continues to rise. Terminal dust holding capacity for MERV-13 pleated media ranges from 50 to 100 g/m², which is roughly half the capacity of MERV-8 at equivalent face velocity, because the denser fiber matrix compresses the cake at lower areal mass thresholds.
HEPA Final Stage: 99.97% Efficiency at 0.3 Microns
The 0.3 micron rating for HEPA media is not arbitrary: it corresponds to the most penetrating particle size (MPPS) in the particle size-efficiency relationship for fibrous filter media. A filter rated 99.97% at 0.3 microns is the worst-case performance point; efficiency rises at both smaller and larger particle diameters.
The HEPA fiber matrix achieves this performance through extreme fiber fineness, sub-micron glass fiber with mean diameters in the 0.5 to 2.0 micron range, packed at high density. This structure is precisely what makes HEPA media vulnerable to rapid cake-induced pressure escalation when handling the fine particle fractions present in occupied commercial duct systems.
Skin cell fragments, respirable-range soot, fungal spores, and fine silica particles all arrive at the HEPA face as irregular, compressible particles with high surface-area-to-mass ratios. These particles pack densely into the shallow surface pores of the HEPA fiber matrix. Compacted cake $r$ values for this particle morphology are 5 to 20 times higher than equivalent mass loadings of coarse construction dust on MERV-8 media.
The pressure spike is immediate and steep: a HEPA stage exposed to unclassified commercial duct debris without upstream pre-filtration can reach terminal pressure drop at 10 to 20 g/m², which is less than 15% of the dust holding capacity available on a coarse pre-filter. This is why exposing a HEPA final stage to direct, unclassified duct debris is a major engineering error. It is not a conservative choice: it is a system design failure that guarantees early CFM collapse and a mid-job filter change.
The interaction between filter loading and the mechanical power draw escalation on the extraction motor is the same phenomenon documented for building AHU fans: increased resistance forces the motor to higher brake horsepower to maintain the same volumetric output. The complete mechanical efficiency analysis connecting these dirty ducts hvac efficiency variables to utility cost escalation applies to extraction equipment operating dynamics in precisely the same way it applies to building air handlers.
The Boundary Loss: Why Caked Filters Truncate Extraction Transport Velocity
Transport velocity in a duct system is not a fixed equipment parameter: it is an instantaneous value determined by the intersection of the fan performance curve and the system resistance curve.
The fan performance curve for a centrifugal or axial extraction fan plots static pressure output against volumetric flow rate. It is a monotonically decreasing curve: as system resistance increases (higher static pressure demand), delivered CFM drops along the curve toward the shutoff point. The system resistance curve plots the total pressure drop required to move air through the duct network and the extraction equipment’s internal filtration at each flow rate, governed by the square-law relationship:
$$\Delta P_{system} = K \cdot Q^2$$
Where $K$ is the system resistance coefficient and $Q$ is volumetric flow. When the filter loads and internal resistance increases, $K$ increases and the system curve rotates counterclockwise. The new operating point shifts to lower $Q$ at higher $\Delta P$.
The 3,500 FPM transport velocity threshold in a 12-inch diameter trunk line requires a minimum sustained 2,748 CFM:
$$A = \pi r^2 = \pi \times (0.5\ ft)^2 = 0.785\ ft^2$$
$$Q_{min} = 3{,}500 \times 0.785 = 2{,}748\ CFM$$
A single-motor portable unit rated at a nominal 2,000 CFM is already operating below the 2,748 CFM transport minimum in a 12-inch trunk at clean filter baseline. The moment that unit’s filter begins loading and $K$ increases, delivered CFM drops further. By mid-job on a moderately contaminated commercial system, a 2,000 CFM unit is delivering 1,200 to 1,500 CFM against a loaded filter, producing approximately 1,500 to 1,900 FPM in the trunk. Coarse debris settles and fiber fragments resettle on cleaned surfaces, producing an incomplete result measurable on post-clean particulate count testing.
A shop-vac operating at 150 to 300 CFM does not approach transport velocity in any commercial duct geometry. At 300 CFM in a 12-inch trunk:
$$V = \frac{Q}{A} = \frac{300}{0.785} = 382\ FPM$$
382 FPM is 11% of the required transport velocity. Debris is not being transported: it is being disturbed and redistributed.
The 5,000 CFM baseline of a Tri-Motor extraction system provides a CFM reserve sufficient to absorb the progressive fan curve shift caused by filter loading without dropping below transport minimums during the active extraction window of a commercial job. But that reserve has boundaries: without a staged filtration architecture that manages the rate of $K$ increase, even a 5,000 CFM system will reach the transport velocity floor if a single-stage HEPA filter loads to terminal resistance mid-job.
Multi-Stage Architecture: Managing Particulate Mass Gradients in Real-Time
The engineering solution to the filter loading problem is not a higher-capacity single-stage filter: it is a staged filtration architecture that distributes dust mass loading across geometrically separated media planes, each optimized for a specific particle size range and loading rate. The DuctPro 3-Stage filtration system addresses this through a defined particle classification sequence.
Stage 1: High-Capacity Bulk Pre-Filter
The first stage is a high-capacity, coarse-efficiency bulk pre-filter designed to capture the mass fraction of the debris load. Commercial duct debris is not uniformly distributed across particle sizes: by mass, the load is dominated by coarse particles like lint aggregates, skin cell clusters, construction debris fines, and fiber bundles, with most falling in the 10 to 100 micron range.
A properly dimensioned pre-filter stage can capture 60 to 80% of the total debris mass entering the extraction system on a representative commercial job. This mass fraction never reaches Stage 2 or Stage 3. The pre-filter cake builds on a low-$r$ coarse layer, meaning pressure drop growth rate is slow and the bulk of the system resistance budget is consumed gradually across a media with high structural dust holding capacity.
The pre-filter is the sacrificial component: it is designed to load, be inspected during the job, and be replaced or emptied as needed. Clearing the pre-filter mid-job on a heavily contaminated system resets the Stage 1 resistance contribution to baseline and extends the active extraction window without interrupting Stage 2 or Stage 3 performance.
Stage 2: Pleated Polyester Secondary Filter
The intermediate stage receives airflow from which the coarse mass fraction has already been removed. Remaining particles are predominantly in the 1.0 to 10.0 micron range: fine construction gypsum, respirable fiber fragments, biological particulate, and secondary aerosols.
The pleated polyester geometry of the secondary filter provides substantially increased media surface area compared to a flat panel at equivalent face dimensions. Increased surface area reduces face velocity $V$ at constant total volumetric flow. From the Darcy equation, reducing $V$ reduces $\Delta P$ proportionally at any given $M_c$ value. The pleated geometry directly extends the time-to-terminal-pressure-drop by reducing the face velocity loading rate on the media.
Stage 3: Rigid HEPA Final Stage
The terminal stage receives airflow carrying only the sub-micron and low-mass fine fraction that passes both upstream stages. The 99.97% efficiency at 0.3 microns HEPA panel provides the hospital-grade indoor air quality (IAQ) assurance that prevents extracted particulate from re-entering the occupied space.
Because Stages 1 and 2 have removed the mass-dominant coarse and intermediate particle fractions, the HEPA stage in a properly managed 3-stage system loads at a fraction of the rate it would experience in a single-stage or two-stage architecture. The $M_c$ accumulation rate on the HEPA surface is low, meaning the $r$ value of the fine-particle cake remains relatively low due to the reduced areal mass, allowing terminal pressure drop across the HEPA stage to remain manageable through a full commercial job cycle. Transport velocity remains securely above 3,500 FPM in the working trunk segment from first pull to final verification pass.
Post-Project Filter Asset Field Diagnostics and Replacement Parameters
Filter assessment at job completion is not a visual inspection exercise: pressure drop measurement is the only quantitative diagnostic tool.
Differential Pressure Measurement Protocol
Using a digital manometer with $\pm0.001$ in. w.c. resolution, measure static pressure at taps located immediately upstream and downstream of each filter stage at the rated extraction face velocity. Record $\Delta P$ for each stage independently. Compare measured values against the manufacturer’s published clean and terminal pressure drop specifications:
| Filter Stage | Typical Clean ΔP | Terminal ΔP (Replace Threshold) |
| Stage 1 Pre-filter | 0.05 to 0.10 in. w.c. | 0.30 to 0.50 in. w.c. |
| Stage 2 Pleated Secondary | 0.15 to 0.25 in. w.c. | 0.80 to 1.20 in. w.c. |
| Stage 3 HEPA Final | 0.50 to 1.00 in. w.c. | 1.75 to 2.50 in. w.c. |
A Stage 3 reading above 1.75 in. w.c. at rated face velocity indicates the HEPA panel has reached terminal loading. The panel must be replaced before the next job: operating a loaded HEPA stage shifts the entire system fan curve to a low-CFM operating point from the moment the next job starts, eliminating the CFM reserve that prevents transport velocity collapse.
Structural Integrity Assessment
Beyond pressure drop, inspect each stage for:
- Media face penetrations or tears: Any breach in the HEPA face seal or gasket perimeter constitutes a filter bypass path. Particles larger than the breach geometry pass uncaptured: the 99.97% efficiency rating applies to the intact filter only.
- Pre-filter frame deformation: Coarse particle impaction at high face velocity can deform lightweight pre-filter frames over multiple use cycles. A deformed frame creates bypass channels at the filter-to-housing seal perimeter. Verify frame geometry against the housing interface tolerance, which is typically $\pm1/16$ inch on all faces.
- Secondary filter pleat collapse: Inspect the pleated media cross-section from the downstream face. Collapsed pleats reduce the effective media area and locally increase face velocity at surviving pleat channels, accelerating loading non-uniformly and creating high-resistance hot spots.
Replacement Decision Matrix
- Replace Stage 1 (pre-filter) when $\Delta P$ exceeds the terminal threshold or when debris volume fills more than 75% of the collection capacity by visual inspection.
- Replace Stage 2 (secondary) when $\Delta P$ exceeds 1.00 in. w.c. at rated face velocity, or when any pleat collapse is observed.
- Replace Stage 3 (HEPA) when $\Delta P$ exceeds 1.75 in. w.c., when any face seal breach is detected, or after every 200 to 300 operating hours of commercial extraction duty regardless of measured pressure drop, because HEPA media mechanical fatigue from vibration-induced fiber stress is not captured by static pressure measurement.
Sustained CFM Demands Aerodynamic Particle Management
The engineering case across this article reduces to a single operational principle: sustained extraction CFM is a filtration management problem, not just a motor specification.
A 5,000 CFM Tri-Motor system delivers its performance advantage only when the filter architecture prevents the fan operating point from shifting to low-CFM territory during the active extraction window. That requires:
- A Stage 1 pre-filter sized to absorb the coarse mass fraction without reaching terminal $\Delta P$ before job completion
- A Stage 2 pleated secondary designed with sufficient face area to maintain sub-critical face velocity under intermediate particle loading
- A Stage 3 HEPA operating in a particle environment where upstream stages have removed the high-$r$ fine-particle fractions that cause rapid cake compaction
- Mid-job pre-filter assessment and clearing on heavily contaminated commercial jobs
- Post-job differential pressure measurement across all three stages before the next deployment
The modified Darcy equation is not an academic exercise: $r \cdot M_c$ is increasing on every job in real time. The technician who understands that curve can manage it; the technician who does not will observe unexplained mid-job performance drops and attribute them to hardware failure, when the true cause is filter cake compaction that a simple pre-filter clearing interval would have prevented.
Professional extraction performance is the product of motor engineering and particle management discipline applied simultaneously. The DuctPro air duct cleaning systems architecture provides both the 5,000 CFM volumetric capacity and the 3-Stage filtration framework required to sustain it through a commercial job cycle.